I like how you hated it so much, you tried it multiple times 😆
I can’t stomach anything with tonic water. It must be an acquired taste because it’s so bad.
I like how you hated it so much, you tried it multiple times 😆
I can’t stomach anything with tonic water. It must be an acquired taste because it’s so bad.
That’s honestly pretty amazing that you’ve been here a year and haven’t seen a troll! Though you’re on an instance with a very active and determined admin, there is definitely a difference in how much you see between instances because of how removals work.
The matrix one
Well in you hop then, while I’m sorting out how to do graphs. I’ve removed the expiry so you can finish your submission.
Anyone else can hop in too if you haven’t done it, as long as you’re quick 🙂
If you search with the term “ice cream float” instead of “spider”, there are plenty of recipes!
E.g.
I’m not willing to try it since I don’t like wine, but I encourage you to give it a go and report back!
Me as an instance admin sitting here reading about how Lemmy doesn’t have trolls and Russian bots, while I’m in a chat with other instance admins and mods where we need to actively coordinate to fight the trolls and Russian bots 😐


From what I’ve seen, they aren’t building the games, they are licensing existing ones. There are decent games in the mix.

This is really cool! There’s always a question around datacentres and water use, being able to reuse it is amazing!
One thing I learnt in making the jump to Linux as a daily driver is to keep all my documents and files on a separate partition. There are so many distros that I wanted to test a few, and I got sick of copying 600GB around all the time. Much easier to keep them separated on a partition away from the boot partition.
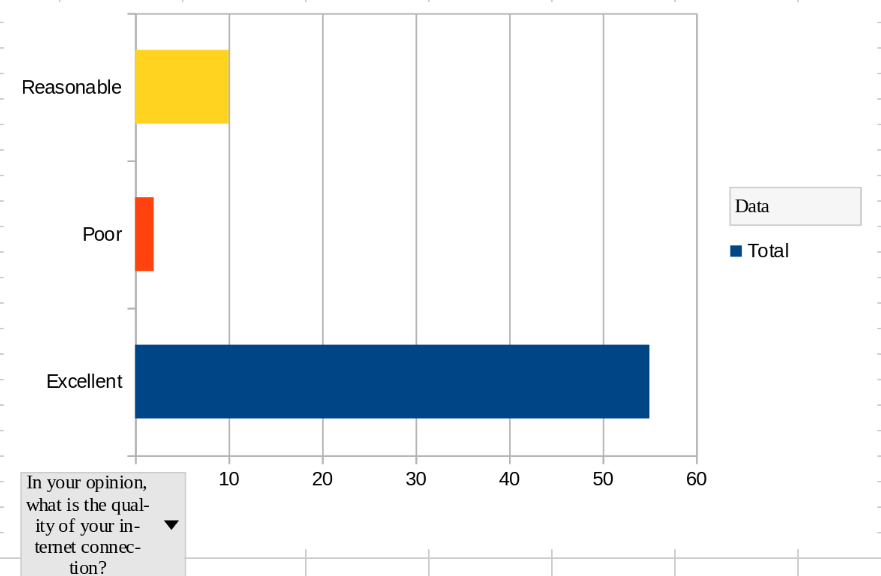
Haha one of my pet peves for data visualisation is graphs that don’t start at zero. I get sometimes the movement is too small to visualise properly when you start from zero, but you can’t probably understand the scale if you don’t start at zero.
I bet you’ll argue with me on that!
Everyone might get their 15 minutes of fame, but it may not be for a good reason. Try not to be a murderer or an Elon Musk.
You might just be the person that the news videos falling over in the wind to demonstrate how windy it is today. Still counts.
I think pie charts are also helpful for when you have 10 categories but two of them make up 90% of the result.
But your bar chart preference is noted, so I’ll try to make sure to include them along side pie charts 🙂
Awesome, thanks! I’ll have a play with this over the weekend.
Thanks! I did pictrs some time back when I was setting up the cache cleaner that needed pictrs 0.5. And then in anticipation of this update I did the postgres 16 update a week or two back.
I know the instructions say you have to dump and import the database, but postgres supports an in-place upgrade. I used this helper container: https://github.com/pgautoupgrade/docker-pgautoupgrade
Basically you swap the postgres image to this one and set the tag to the version you want, then recreate the container, watch the logs until it’s done, shut it down, and swap the tags to the new postgres image and recreate the container again. It handles the magic and it happens really quickly.
Hey on another note, do you know your federation with Lemmy.world is super far behind and you’re losing content because Lemmy stops trying when activities are over a week old? We had the same issue a while back but managed to solve it with a Finland VPS that batches the activities to send them. I’m happy to point you to someone who can help if you’re interested!
Ooh thanks! I’ll definitely have a play with this. What’s the step before this? Is it as simple as installing python, putting the code in somefile.py, then running it?
LibreOffice Calc supports its own macro language as well as a subset of VBA! I recently converted an Excel macro to LibreOffice and it wasn’t too painful.
I dunno. I feel something like this works better as a pie chart.
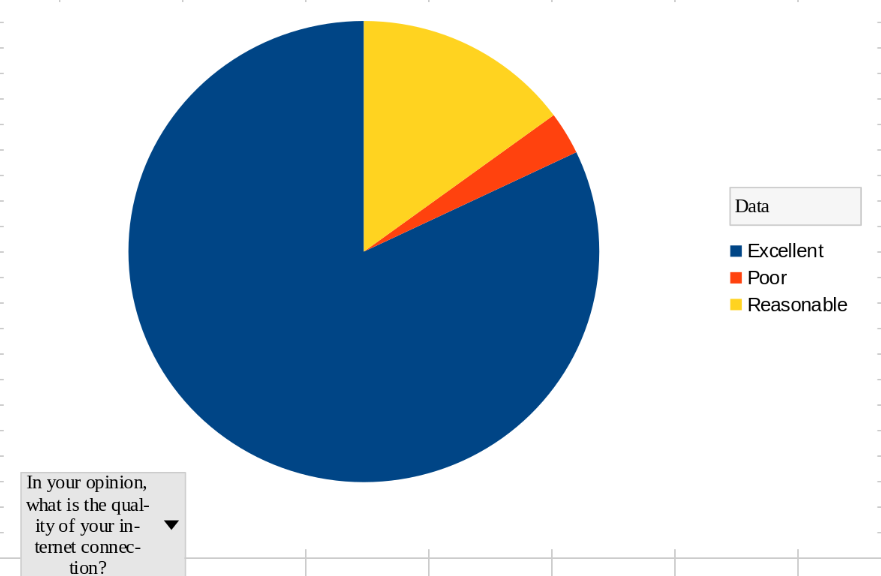
Mainly I don’t like that the pie charts are hard to tell what is what. If there are 6 or 7 things and you have to tell which is which by colour, that’s a bit tricky. Labels on the sections would be better, but I haven’t worked out how to do that.
Maybe if I think a pie chart shows it best, I’ll also include the bar chart so it’s clearer.


That’s a good question. No harm in emailing politicians asking how they can solve it. If we don’t have the laws to stop it now, politicians will be needed, and it’s important that they get a feel for the general publics view.